|
Software & Hardware
Hardware
Xampling: Analog to Digital at Sub-Nyquist Rates
In this page, we present a sub-Nyquist hardware prototype, based on the MWC [1] [2] for cognitive radio and multiband sampling.
We first provide an overview of the entire MWC cognitive radio (CR) prototype. We then address support recovery of the signal and explain how to perform signal reconstruction. Finally, we discuss the hardware calibration process that enables the entire prototype to operate.
MWC Prototype
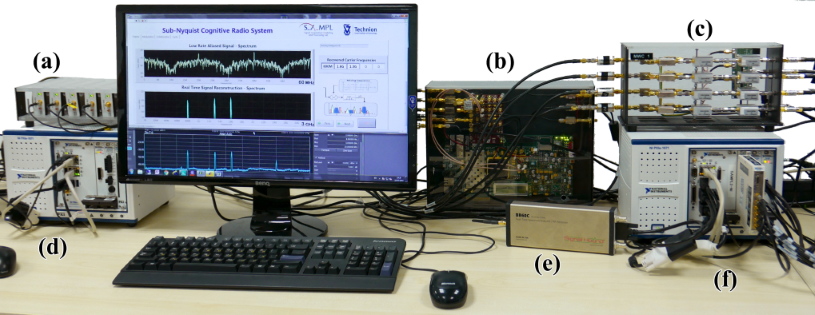
Fig. 1. MWC CR system prototype: (a) vector signal generators, (b) FPGA mixing sequences generator,
(c) MWC analog front-end board, (d) RF combiner, (e) spectrum analyzer, (f) ADC and DSP.
One of the main aspects that distinguish the MWC from other sub-Nyquist sampling schemes is its practical implementation [3], proving the feasibility of sub-Nyquist sampling even under distorting effects of analog components and physical phenomena. A hardware prototype, which can be seen in Fig. 1, was developed and built
according to the block diagram in Fig. 2. The main hardware components that were used in the prototype can be seen in Fig. 3. In particular, the system receives an input signal
with Nyquist rate of 6GHz and spectral occupancy of up to 200 MHz, and samples at an effective rate of 480 MHz, that is only 8% of the Nyquist rate and 2.4 times the Landau rate.
This rate constitutes a relatively small oversampling factor of only 20% with respect to the theoretical lower sampling bound.
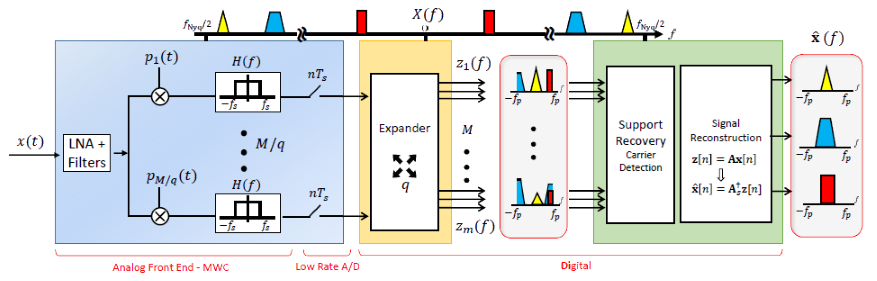
Fig. 2. Schematic implementation of the MWC analog sampling front-end and digital signal recovery from low rate samples.
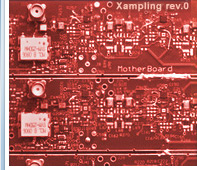
At the heart of the system lies the proprietary MWC board [3] that implements the sub-Nyquist analog
front-end. The card uses a high speed 1-to-4 analog splitter that duplicates the input wideband signal to
M
= 4 channels, with an expansion factor of
q
= 5, yielding
Mq
= 20 virtual channels after digital expansion. Then, an analog preprocessing step, composed of preliminary equalization, impedance corrections and gain adjustments, aims at maintaining the dynamic range and fidelity of the input in each channel. Indeed, the signal and mixing sequences must be
amplified to specific levels before entering the analog mixers to ensure proper behavior emulating mathematical multiplication with the mixing sequences. The entire analog path of the multiband input signal can be seen in Fig. 4.
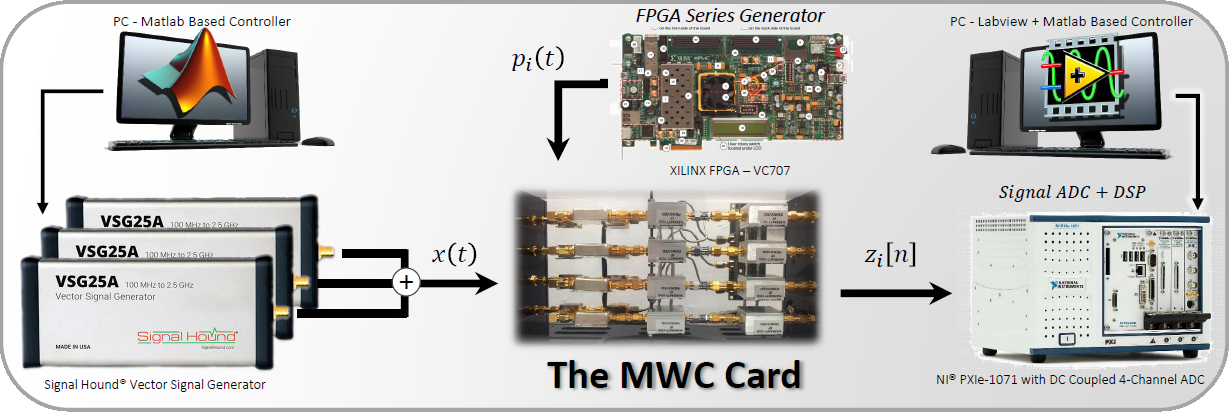
Fig. 3. Hardware implementation of the MWC prototype, including the RF vector signal generators,
analog front-end board, FPGA series generator, ADC and DSP.
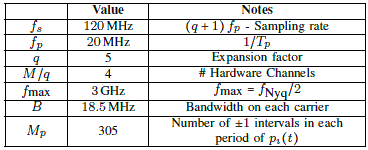
Table 1
The MWC Parameters used in the setup of Fig. 1.
The modulated signal next passes through an analog antialiasing LPF. The anti-aliasing filter must be characterized by an almost linear phase response in the pass band between 0 to 50MHz and an attenuation of more than 20dB at
2fs
= 60 MHz. Chebyshev LPF of 7th order with cut-off frequency (−3 dB) of 50MHz was chosen for the implementation. After impedance and gain corrections, the signal has a spectral content limited to 50 MHz, that contains a linear combination of the occupied bands with different amplitudes and phases, as seen in Fig. 5. Finally, the low rate analog signal is sampled by a National Instruments© ADC operating at 120 MHz, leading to a total sampling rate of 480 MHz.
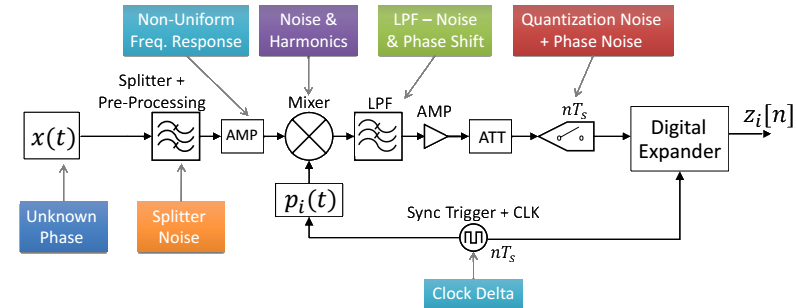
Fig. 4. Hardware RF chain detailed schematics, including amplifiers, attenuators, filters, mixers, samplers and synchronization signals
required for precise and accurate operation. The distortions induced by each components are indicated as well.
The mixing sequences that modulate the signal play an essential part in signal recovery. They must have low cross correlations with each other, while spanning a large bandwidth determined by the Nyquist rate of the input signal, and yet be easy enough to generate with relatively cheap, off-the-shelf hardware. The sequences
pi(t)
, for i = 1,...,4, are chosen as truncated versions of Gold Codes [4], which are commonly used in telecommunication (CDMA) and satellite navigation (GPS). Mixing sequences based on Gold codes were found to give good results in the MWC system [5], primarily due to small bounded cross-correlations within a set.
Since Gold codes are binary, the mixing sequences are restricted to alternating ±1 values. This fact allows to digitally generate the sequences on a dedicated FPGA. Alternatively, the sequences could be implemented on a small chip with low power and complexity. The added benefit of producing the mixing sequences on such a platform is that the entire sampling scheme can be synchronized and triggered using the generating FPGA with minimally added phase noise and jitter, keeping a closed synchronization loop with the samplers and mixers. A Xilinx VC707 FPGA acts as the central timing unit of the entire sub-Nyquist CR setup by generating the mixing sequences and the synchronization signals required for successful operation. It is crucial that both the mixing period
Tp
and the low rate samplers operating at
(q + 1)fp
(+1 due to intended oversampling) are fully synchronized, in order to ensure correct modeling of the entire system, and consequently guarantee accurate support detection and signal reconstruction.
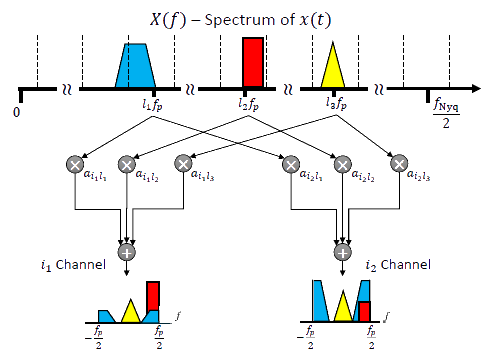
Fig. 5. The spectrum slices of the input signal
x(f)
are shown here to be multiplied by the
coefficients
ail
of the sensing matrix A, resulting in the measurements
zi
for the ith channel.
The digital back-end is implemented using a National Instruments PXIe-1065 computer with DC coupled ADC. Since the digital processing is performed at the low rate
fs
, very low computational load is required in order to achieve real time recovery. MATLAB® and LabVIEW® environments are used for implementing the various digital operations and provide an easy and flexible research platform for further experimentations. The sampling matrix A is computed once offline, using the calibration process outlined in [6] and described below.
Support Recovery

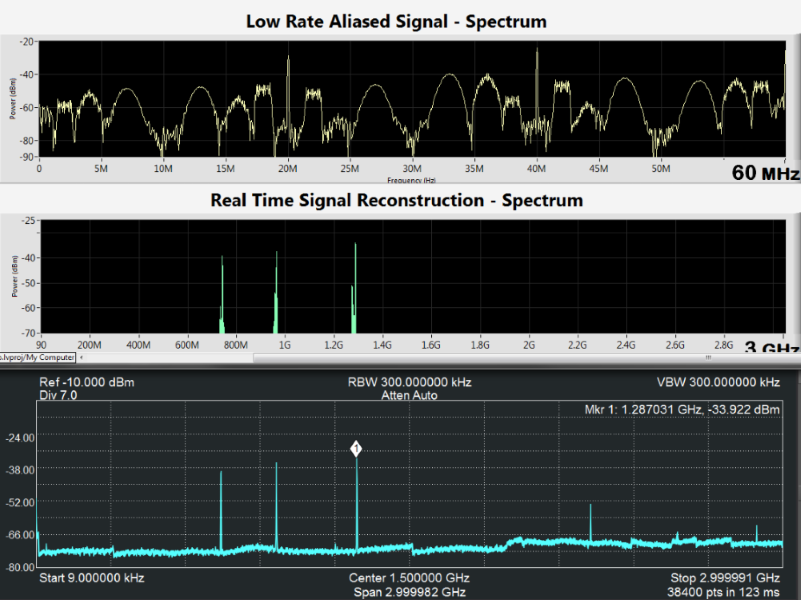
Fig. 6. Screen shot from the MWC recovery software: low rate samples acquired from one MWC channel at rate 120MHz (top), digital reconstruction of the entire spectrum, performed from sub-Nyquist samples (middle), true input signal
x(t)
showed using a fast spectrum analyzer (bottom).
Fig. 7. The setup is identical to Fig. 6. In this case the individual transmissions have low bandwidth, highlighting the structure of the signals when folding to baseband.
The prototype is fed with RF signals composed of up to 5 carrier transmissions with an unknown total bandwidth occupancy of up to 200MHz and Nyquist rate of 6 GHz. An RF input
x(t)
is generated using vector signal generators (VSG), The input transmissions then goes through an RF combiner, resulting in a dynamic multiband input signal. This allows to test the system’s ability to rapidly sense the input spectrum and adapt to changes, as required by modern CR standards.
Support recovery is digitally performed on the low rate samples. The prototype successfully recovers the support of the transmitted bands transmitted, when SNR levels are above 15 dB, as demonstrated in Fig. 6. More sophisticated detection schemes, such as cyclostationary detection [10], allow to achieve perfect support recovery from the same sub-Nyquist samples in lower SNR regimes of 0-5 dB.
The main advantage of the MWC is that sensing is performed in real-time for the entire spectral range, even though the operation is performed solely on sub-Nyquist samples, which results in substantial savings in both computational and memory complexity. In additional tests, it is shown that the bandwidth occupied in each band can also be very low without impeding the performance, as seen in Fig. 7 where the support of signals with very low bandwidth (just 10% occupancy within the 20 MHz band) is correctly detected.
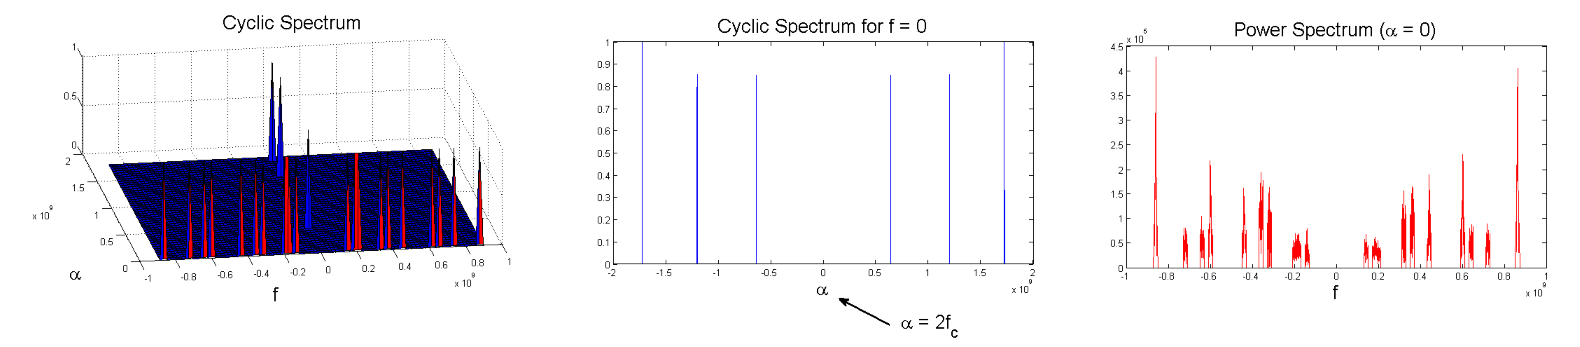
Fig. 8. Screen shot from the MWC CR prototype with cyclostationary detection. The input signal is composed of
Nsig
= 3 transmissions (or
K
= 6 bands) with carriers
f1
= 320 MHz,
f2
= 600 MHz and
f3
= 860 MHz. We can see the recovered cyclic spectrum from low rate samples (left), the cyclic spectrum profile at the angular frequency
f
= 0; the cyclic peaks are clearly visible at twice the carrier frequencies (middle), and the power spectrum recovery is shown to fail in the presence of noise (right).
Signal Reconstruction
Once the support is recovered, the signal is reconstructed from the sub-Nyquist samples. Reconstruction is performed by inverting the reduced sampling matrix
As
on the recovered support.

This step is performed in real-time, reconstructing the signal bands
z[n]
one sample at a time, with low complexity due to the small dimensions of the matrix-vector multiplication. We note that reconstruction does not require interpolation to the Nyquist grid. The active transmissions are recovered at the low rate of 20 MHz, corresponding to the bandwidth of the slices
z(f).
The prototype’s digital recovery stage is further expanded to support decoding of common communication modulations, including BPSK, QPSK, QAM and OFDM. An example for the decoding of three QPSK modulated bands is shown in Fig. 9. There are no restrictions regarding the modulation type, bandwidth or other parameters, since the baseband information is exactly reconstructed regardless of its respective content.
By combining both spectrum sensing and signal reconstruction, the MWC prototype serves as two separate communication devices. The first is a state-of-the-art CR that can perform real time spectrum sensing at sub-Nyquist rates, and the second is a unique receiver able to decode multiple data transmissions simultaneously, regardless of their carrier frequencies, while adapting to spectral changes in real time.

Fig. 9. Demodulation, reconstruction and detection of
Nsig
= 3 inputs from sub-Nyquist samples using the
MWC CR prototype. At the bottom, the signal is sampled by an external spectrum analyzer showing the entire
bandwidth of 3 GHz. Sub-Nyquist samples from an MWC channel
zi[n]
in the Fourier domain are displayed in the
middle. The I/Q phase diagrams, showing the modulation pattern of the transmitted bands after reconstruction
from the low rate samples, are presented at the top left. In the upper right corner, we see the information
that was sent on each carrier, proving successful reconstruction.
Hardware calibration of the MWC
In the sampling system described above, the system matrix A is theoretically known and contains the Fourier series coefficients of the mixing sequences, such that

When calculating the matrix coefficients using (2), perfect support recovery and signal reconstruction is guaranteed both theoretically and by numerical verification performed in software simulations. However, in practice, analog and physical distortions and imperfections affect the mixing and sampling process, and some modeling assumptions, that describe the system matrix in theory, no longer hold. The main effects that distort the transfer function are:
-
The mixing procedure introduces nonlinearities. In general, mixers are intended to modulate narrowband signals with one sine carrier, as opposed to our mixing sequences that effectively contain over a hundred different harmonics.
-
The analog filters have a non-flat frequency response, both in amplitude and phase.
-
The actual design uses amplifiers and attenuators. These components exhibit non-linear frequency response.
-
The phase noise and jitter, due to variations in components, cables and clock deltas lead to unknown and varying time shifts between the mixing and sampling stages.
An accurate method for estimating the effective A is crucial for successful support recovery and signal reconstruction. An adaptive calibration scheme is proposed in [6]. The calibration procedure estimates the elements of A with no prior knowledge on the mixing series
pi(t)
except for their period length
Tp.
Since our system is not time invariant (e.g. samplers), nor linear (e.g. mixers), one cannot find the entries of the system matrix by simply measuring its response to an impulse or step function. To circumvent this difficulty, the system’s response is investigated for every frequency band of the spectrum by injecting known sinusoidal inputs sequentially. In each iteration, the following input

is fed to the system. Here,
f0 = 0.1fp
was heuristically chosen and the amplitudes
αl
increase with l to compensate for the attenuation of the Fourier coefficients of the mixing sequences in high frequencies. Every sine wave corresponds to a specific spectral band and translates to the relevant column of the matrix
A.
The sub-Nyquist samples are then digitally processed to estimate the system matrix coefficients, column by column.
Performance of the calibrated system is shown in Fig. 9.
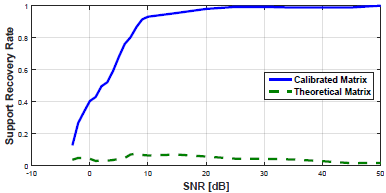
Fig. 10. Hardware reconstruction success rate of the calibrated matrix versus the theoretical matrix.
Sub-Nyquist Cognitive Radio Demo System
Sub-Nyquist Cognitive Radio Demo System at IEEE Globecom 2014
Collaborative Cognitive Radio
References
-
M. Mishali and Y. C. Eldar, "Sub-Nyquist Sampling: Bridging Theory and Practice", IEEE Signal Processing Magazine, vol. 28, issue 6, pp. 98-124, Nov. 2011.
-
M. Mishali and Y. C. Eldar, "From Theory to Practice: Sub-Nyquist sampling of Sparse Wideband Analog Signals", IEEE Journal of Selected Topics on Signal Processing, vol. 4, issue 2, pp. 375-391, Apr. 2010.
-
M. Mishali, Y. C. Eldar, O. Dounaevsky, and E. Shoshan, “Xampling: Analog to Digital at Sub-Nyquist Rates”, IET Circuits, Devices and Syst., vol. 5, pp. 8–20, Jan. 2011.
-
R. Gold, “Optimal Binary Sequences for Spread Spectrum Multiplexing (corresp.)”, IEEE Trans. Inf. Theory, vol. 13, no. 4, pp. 619–621, 1967.
-
M. Mishali and Y. C. Eldar, “Expected RIP: Conditioning of the Modulated Eideband Converter”, IEEE Inf. Theory Workshop, pp. 343–347, Oct. 2009.
-
E. Israeli, S. Tsiper, D. Cohen, A. Reysenson, R. Hilgendorf, E. Shoshan, and Y. C. Eldar, “Hardware Calibration of the Modulated Wideband Converter”, IEEE Global Commun. Conf., pp. 948–953, Dec. 2014.
-
D. Cohen and Y. C. Eldar, "Sub-Nyquist Cyclostationary Detection for Cognitive Radio", submitted to IEEE Transactions on Signal Processing, April 2016.
-
D. Cohen, L. Pollak, and Y. C. Eldar, “Carrier Frequency and Bandwidth Estimation of Cyclostationary Multiband Signals,” IEEE ICASSP, Mar. 2016.
-
S. Stein, O. Yair, D. Cohen and Y. C. Eldar, "CaSCADE: Compressed Carrier and DOA Estimation", submitted to IEEE Transactions on Signal Processing, April 2016.
-
D. Cohen and Y. C. Eldar. "Cyclic Spectrum Reconstruction from Sub-Nyquist Samples", 2014 IEEE Global Communications Conference. IEEE, 2014.
-
T. Zahavy, O. Shayer, D. Cohen, A. Tolmachev and Y. C. Eldar, "Sub-Nyquist sampling of OFDM signals for cognitive radios", 2014 IEEE International Conference on Acoustics, Speech and Signal Processing (ICASSP), Florence, 2014, pp. 8092-8096.
|
|